Macronutrients & Micronutrients
Primary Fertilizer Products
Anhydrous Ammonia (82-0-0)
Urea (46-0-0)
UAN 32% (32-0-0)
UAN 28% (28-0-0)
DAP (18-46-0)
MAP (11-52-0)
TSP (0-46-0)
NPSZ (12-40-0-7-1)
Potash (0-0-60)
Ammonium Sulfate (21-0-0-24S)
90% Granular Sulfur
85% Granular Sulfur
Symtrex (16-1-0-20S)
Secondary Nutrients
Pelletized Lime
Gypsum
Micronutrients
Boron
Magnesium
Manganese Sulfate
Copper Sulfate
Blends
Most ADM Fertilizer terminals can create customized blends based on your specific needs, like NPSZ (12-40-0-7-1) and more. Please contact your ADM Farm Direct representative about purchasing customized blends in your area.
Your Profit Picture
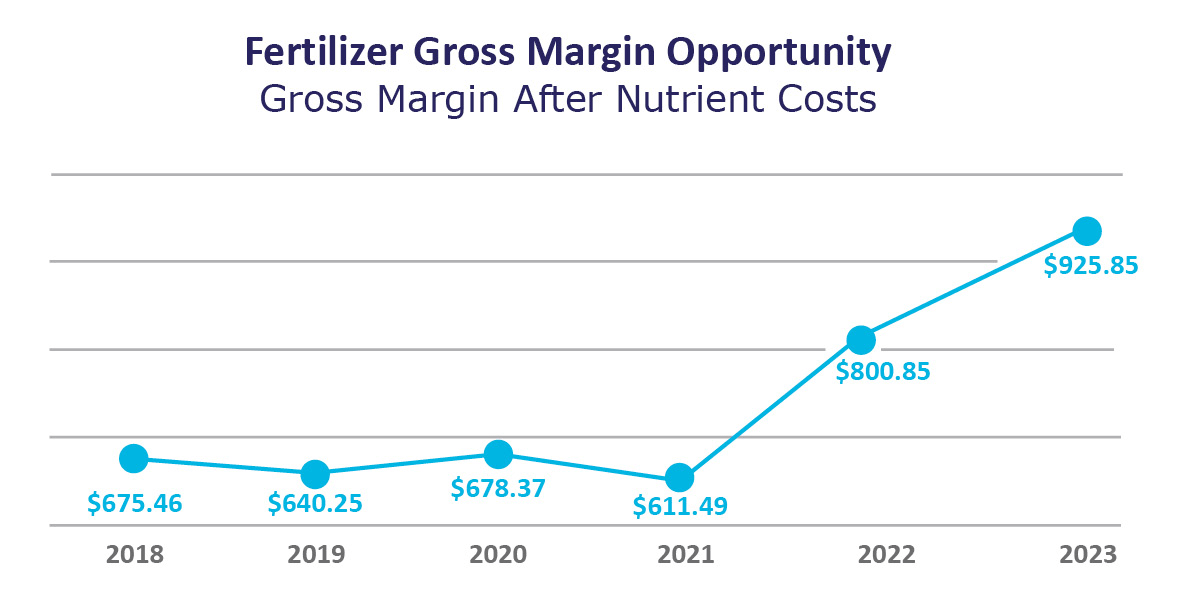
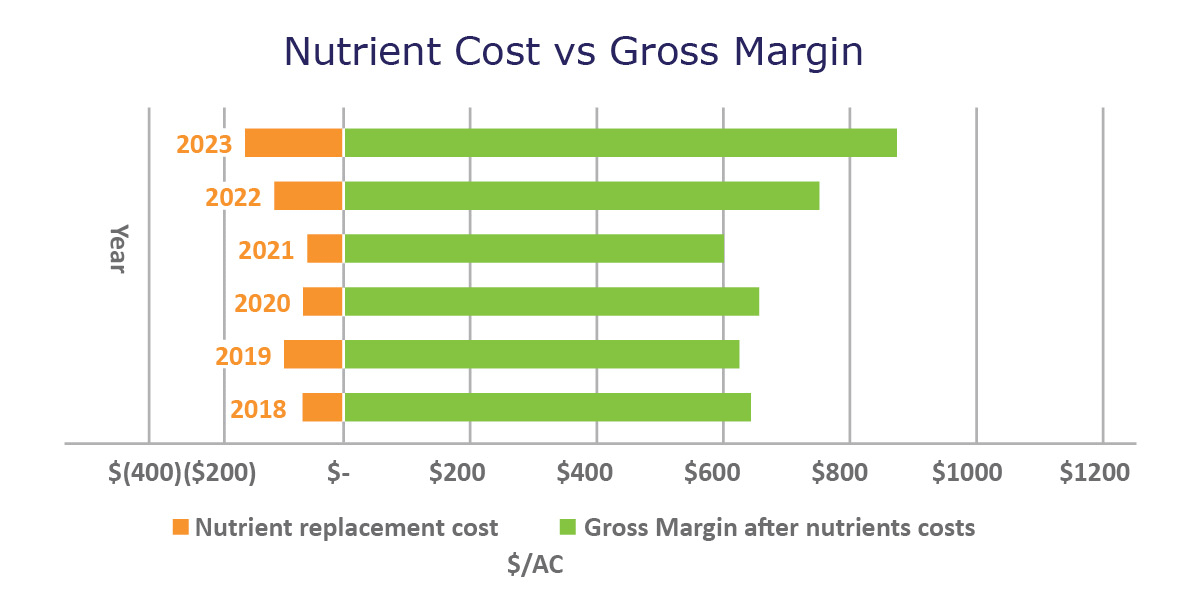
Fertilizer is one of the most important input investments you make every year, so locking in prices when fertilizer markets are more favorable is a crucial part of your operation’s overall profit picture. With the ability to monitor and lock in prices up to a year in advance of delivery as you make grain sales, you have better control of your operating margins and can increase farm income.
This analysis demonstrates the opportunity for high profit margins when forward purchasing fertilizer while locking in grain sales. The graphs assume a farmer sold corn futures and purchased fertilizer for that crop at the same time based upon nutrient replacement value for a 200-bushel corn crop.